Emanuel M Schwermer
Shares of Tesla, Inc. (NASDAQ:TSLA) are responding favorably after CEO Elon Musk’s recent trip to China, where governmental authorities within the Chinese Communist Party (CCP) agreed to lift restrictions related to the company’s driver-assistance technology. China currently possesses the largest electric vehicle (EV) market in the world, accounting for nearly 60% of all electric vehicle sales globally, so this endorsement marks a major milestone in clearing the hurdles which will allow Tesla to ultimately make its Full Self-Driving (FSD) technology available in the Middle Kingdom.
After satisfying China’s strict technological requirements for data security software, Tesla now appears to be one step closer to upgrading its Level 2 systems for driver assistance and bringing vehicles that are capable of fully autonomous driving within the region. Additionally, the company has reached an agreement with Chinese search provider Baidu, Inc. (BIDU), which will allow Tesla to implement its navigation software and mapping data for use in Tesla’s FSD vehicles going forward.
Post-News Reaction Gap (Income Generator via TradingView)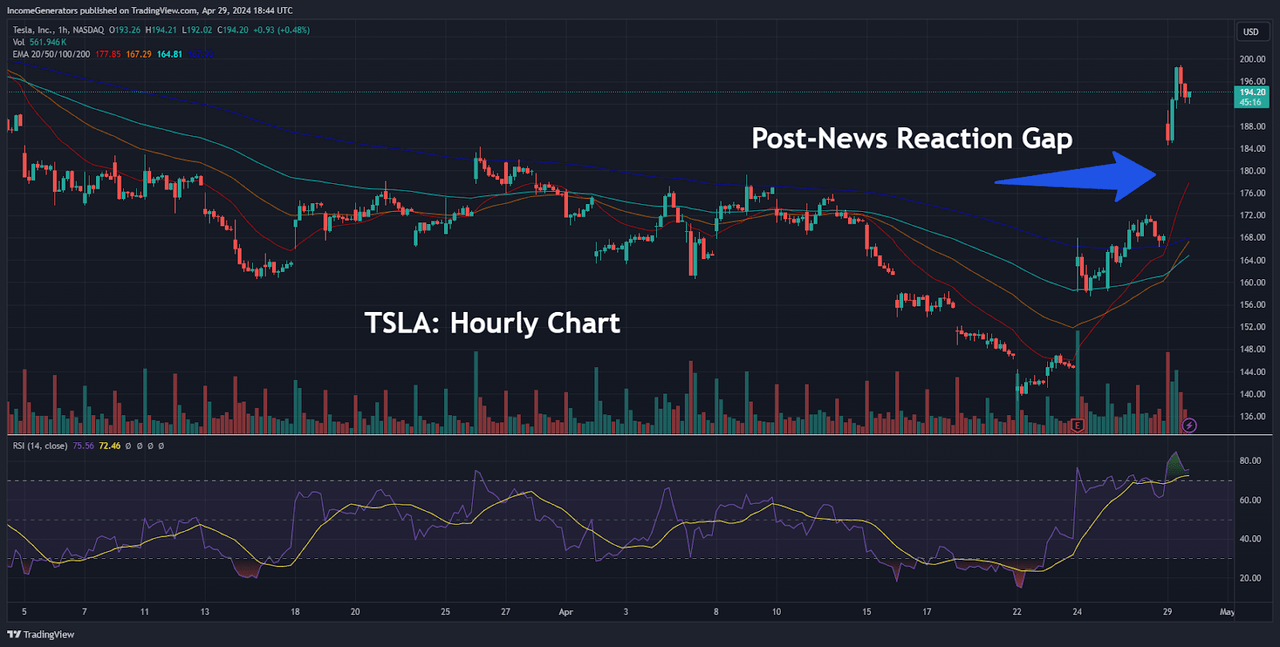
After hearing this news, it is clear that market traders have responded quite favorably, and this has provided some lift to this beaten-down stock. TSLA shares posted an initial rally of roughly 15% following the release of this news, and this has already started to change the outlook for a stock that has seen some very extreme selling pressure since November 2021 (when the stock reached its all-time highs of $414.50).
As we can see, this short-term reaction gap on the hourly chart has sent prices into overbought territory, but the picture starts to look quite a bit different when we look at this most recent price movement within the broader context of Tesla’s longer-term downtrend. As a result, we expect these overbought share price readings to resolve themselves relatively quickly, and we believe that TSLA could be on the verge of a major corrective break-out in the bullish direction.
Prior Weekly Downtrend Breaks (Income Generator via TradingView)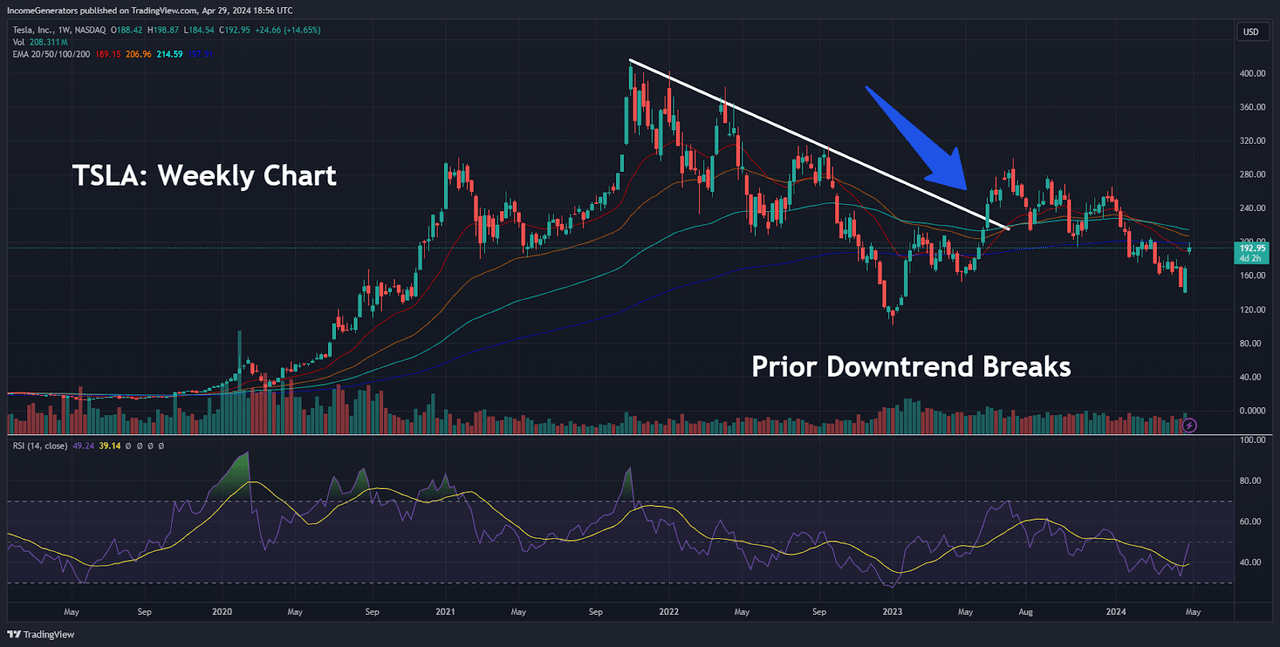
Next, we will assess TSLA share price history from the weekly chart, as this gives us an excellent understanding of the downtrend that has marked price action since November 2021. Here, we can see that the directional decline from the $414.50 highs has been quite dramatic, but the dominant downtrend line has already been broken. This upside break occurred in June 2023, which was also when the stock managed to break through its 20-week, 50-week, 100-week, and 200-week exponential moving average cluster.
TSLA Weekly Chart (Income Generator via TradingView)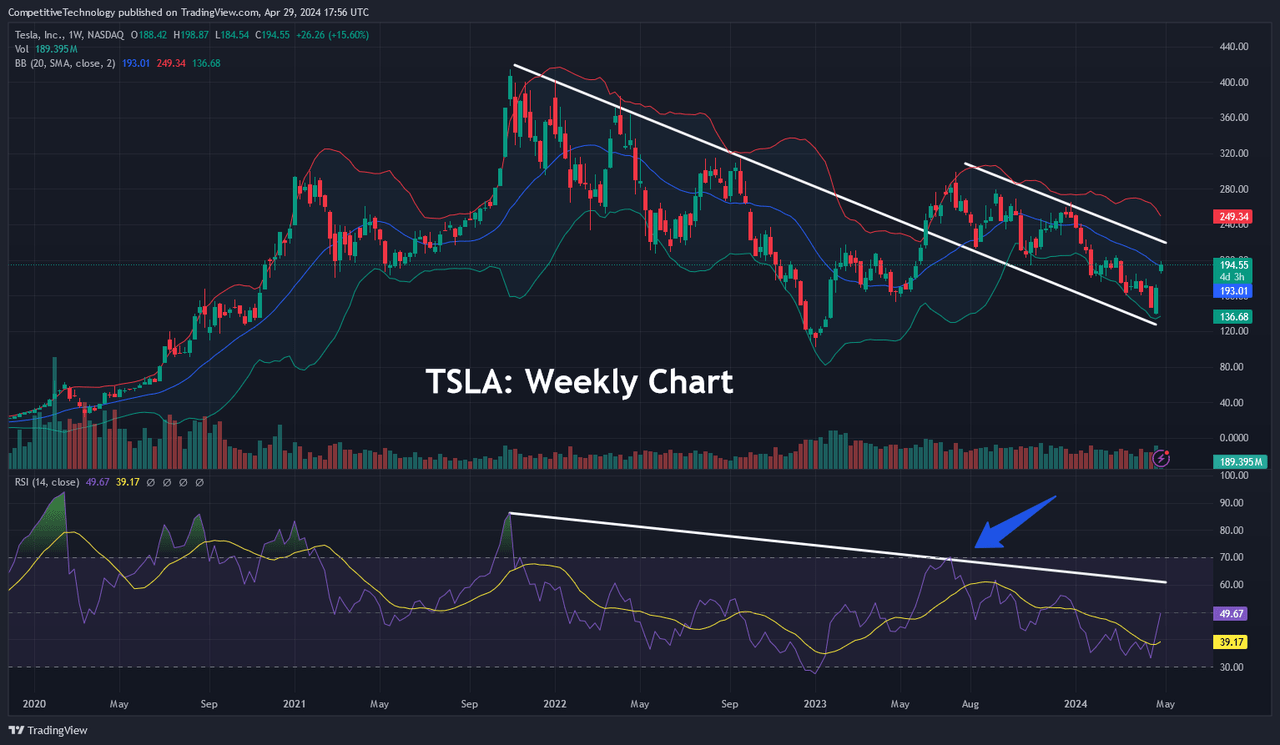
Interestingly, this price action ultimately resulted in another downtrend channel – but it was one that occurred at higher levels. Perhaps this is not entirely surprising, given the fact that indicator readings in the Relative Strength Index (RSI) are still bearish, and this is trend activity that occurred on a very broad timeframe (weekly charts). However, those indicator readings are already turning higher (quite forcefully, in fact) and we are now approaching the mid-point of the histogram (which suggests that prices still have plenty of room to extend in the upward direction before becoming overbought).
TSLA Daily Chart (Income Generator via TradingView)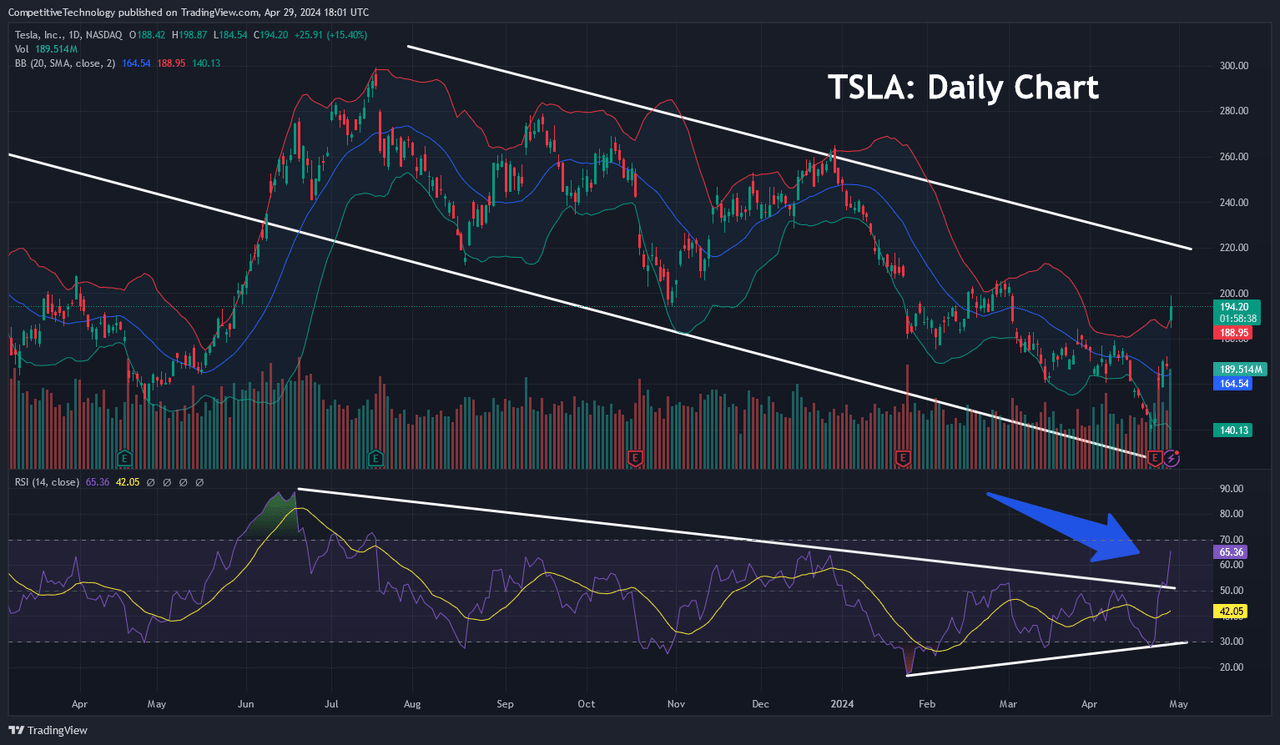
If we look at the current price action from the perspective of a daily chart (which is the charting timeframe that is most commonly watched by technical analysis traders), we can see that indicator readings in the RSI have already developed a bullish break-out. Ultimately, this bullish event could give us an indication of what is most likely to occur on the weekly charts (broader timeframes) and this means that it makes sense for stock traders to start plotting upside resistance points in TSLA ahead of a potential invalidation of the current downtrend price channel.
TSLA: Fibonacci Retracement Levels (Income Generator via TradingView)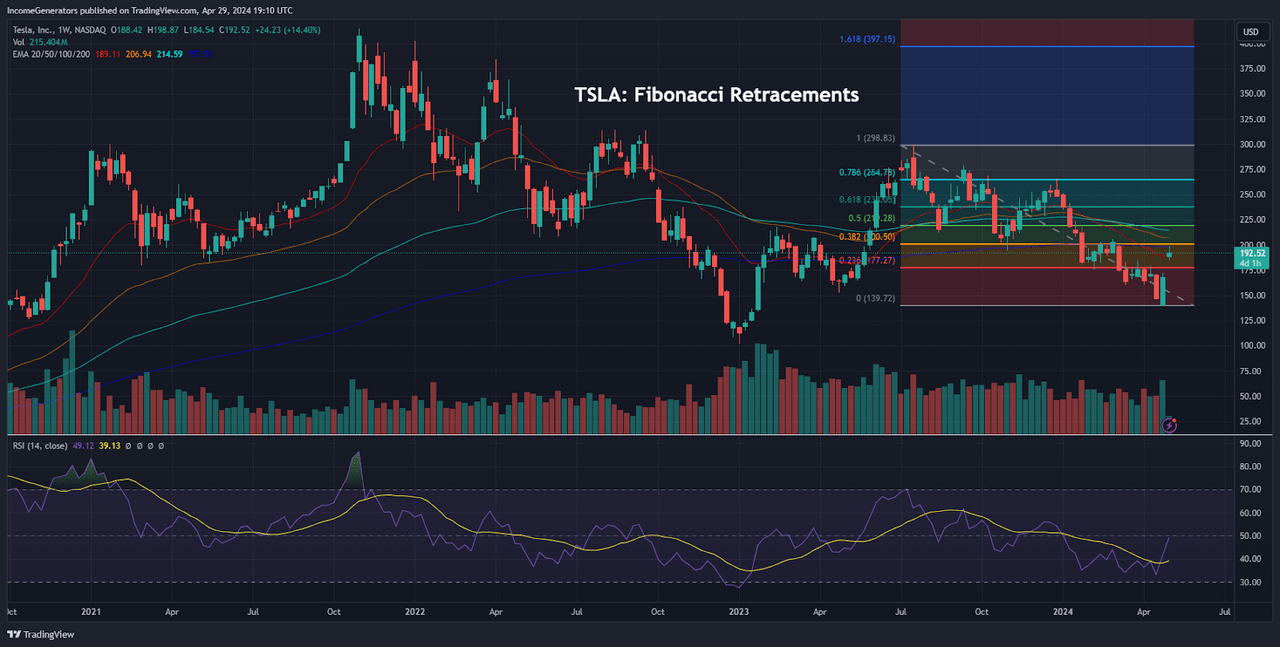
To accomplish this, we will analyze the Fibonacci retracement zones that have formed during the stock’s most recent moves lower. Specifically, the 23.6% Fibonacci retracement of the decline from $299.29 is located at $177.27 and this price region coincides nicely with the TSLA low from February 5th, 2024.
Next, the 38.2% Fibonacci retracement of this downtrend move is located at $200.50, and this is followed by the 50% retracement (located at $218.28). Finally, the 61.8% Fibonacci retracement of this near-term downtrend can be found at $238.05 – but we also think that it will be important to watch the 78.6% retracement of this move (at $264.78) because this aligns almost exactly with the rejection high of $265.13 (which was posted in December 2023).
On the weekly charts, most of the periodic exponential moving averages are located below the 50% retracement of the near-term downtrend move, so if we do see an upside break of this resistance zone, we find it to be highly likely that the upper Fibonacci retracement zones will also be tested relatively quickly.
Overall, we believe that TSLA is currently looking like a strong opportunity for contrarian traders that are looking for a stock that has been caught in a downtrend and appears to be ready for a reversal. Potential risks for this type of trade can be found in the fact that price gaps generally need to be filled (so that current market orders can be exercised); however, we would need to see a clear break below support levels at $158.36 before this would become a cause for concern. When we look at TSLA share prices from a longer-term perspective (weekly charts), we can see that the stock is currently extremely undervalued when compared to its historical averages, and we think that this might represent one of the best contrarian trading opportunities that currently exists in U.S. stock markets.
Editor’s Note: This article discusses one or more securities that do not trade on a major U.S. exchange. Please be aware of the risks associated with these stocks.
