Justin Paget
Today’s analysis revisits our outlook on Tesla, Inc. (NASDAQ:TSLA)(NEOE:TSLA:CA). We last covered the stock in June 2023, reiterating our Strong Buy rating based on fundamental momentum.
Since our last analysis, Tesla has faced a few hardships. Moreover, real economic and stock market-based factors have shifted. As such, we decided it would be a good time to update our thesis.
After assessing numerous variables, we decided to downgrade Tesla to a Hold; here’s why.
Revisiting Tesla’s Fundamentals
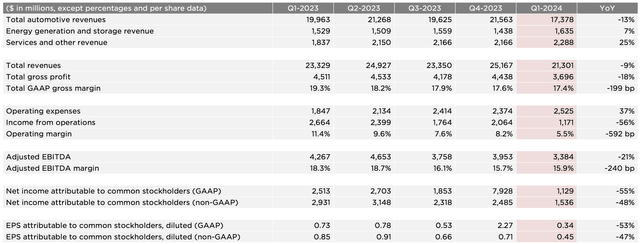
Tesla’s financial results echo various systematic and fundamental concerns. The diagram below shows the firm’s first-quarter results; a discussion follows.
We initially believed that Tesla’s secular growth was robust enough to ensure throughout-the-cycle revenue growth. However, as its Q1 results illustrate, Tesla suffered a 9% pullback in broad-based revenue, primarily due to lower automotive revenue.
Tesla’s energy generation & storage and other services revenue illustrated sustainable growth, likely due to their secular attributes. However, Tesla’s drop in auto revenue suggests the segment has reached a shakeout phase.
A shakeout phase is a stage of an industry’s life cycle that follows an initial growth phase, whereby companies drop their prices to fight for market share. Well, guess what? Tesla and some of its peers have dropped their prices considerably in major markets during the past year.
See the snippet below for critical data points.
Data from April – Tesla Price Cuts (BBC)
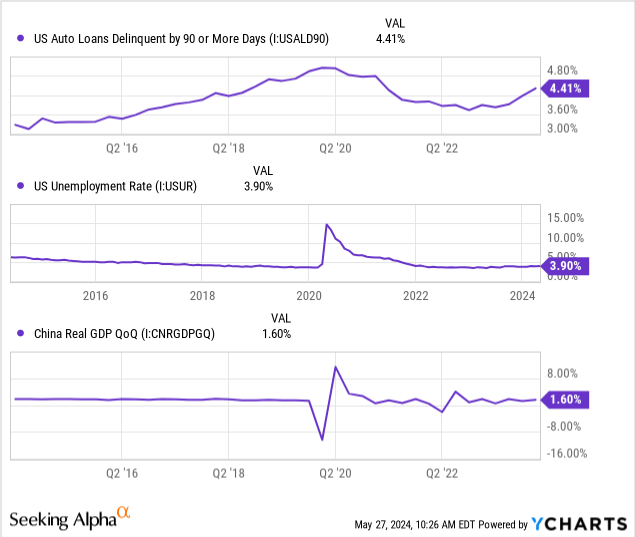
The question now becomes: Will Tesla’s price cuts resume, or are they temporary? Elon Musk claims the price cuts are due to excess production. However, we simply argue that a price war has emerged due to the industry’s competitive nature. Moreover, key economic indicators such as rising automotive delinquency rates, resilient prime lending rates, topsy-turvy consumer sentiment, rising unemployment, and stagflation suggest durable good sales are at risk. Therefore, we argue a ‘lower-for-longer’ price environment for Tesla.
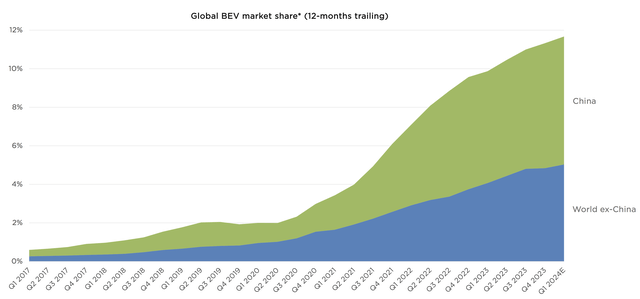
Tesla’s market share remains respectable. However, we see a few issues here.
Firstly, BYD Company Limited leads the world’s EV market share, with approximately 17.1%. According to its latest data, BYD’s (OTCPK:BYDDF) vehicle sales have surged by 23.64% year-to-date to 936,446. This is worrisome for Tesla, as it means it might be losing market share to an arch rival. Moreover, Tesla has emphasized China as a key growth point, which enhances the issues derived from BYD’s sales growth.
Furthermore, the likes of NIO (NIO) and Ford (F) (EV-only) have reported positive results in recent times. NIO’s first quarter results communicated a 25% year-over-year increase in vehicle sales and an 11.9% margin increase, whereas Ford recently reported 687,671 quarterly vehicle sales, a 4.2% year-over-year gain.
The abovementioned numbers are vague, but I’m trying to illustrate that some EV companies have been unhinged by recent systematic pressure, suggesting that Tesla might have structural concerns.
Most of this analysis has been negative. So, before we conclude this section, let’s review a few positives.
Tesla is rolling out new models, which can boost its sales. Firstly, Tesla recently revealed its Model 3 Performance version, which is an updated version of its Model 3 geared toward a niche part of the market. Why niche? Well, this vehicle’s 0-60mph is dealt with in 2.9 seconds, matching the 911 Turbo. In essence, it aims to detract customers from sports car retailers. Furthermore, Tesla is set to release its self-driving Robotaxi on August 8th, throwing a diversification tool into its product line, which could smoothen its top-line earnings.
Another reason Tesla’s slowing sales growth isn’t all doom and gloom is that stagflation could ease the firm’s input costs and level out proceedings. I know this doesn’t justify lower sales growth, but it is a matter worth considering nonetheless.
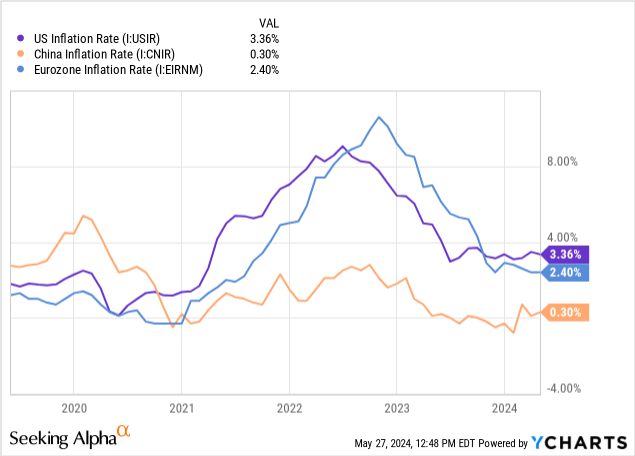
Key Operating Metrics
An observation of Tesla’s key operating metrics communicates interesting talking points. Before I head on into them, keep in mind that it’s all about assessing a time series instead of looking at absolute values in isolation.
Since our last coverage of the stock, Tesla’s cash conversion cycle has reached positive territory. This is largely due to a decline in days payables outstanding. On the other hand, Tesla’s inventory increase is possibly largely due to inflation, but its days sales outstanding (aka receivables) remained flat.
For those unaware, the CCC delineates how long a firm will be deprived of its cash by assessing how long cash is tied up between inventory stocking, receivables, and payables. We think Tesla’s consistent receivable days are encouraging, as it doesn’t indicate forced accounting adjustments. Moreover, the firm’s lower days payable suggest it isn’t forced to stretch payables to preserve liquidity.
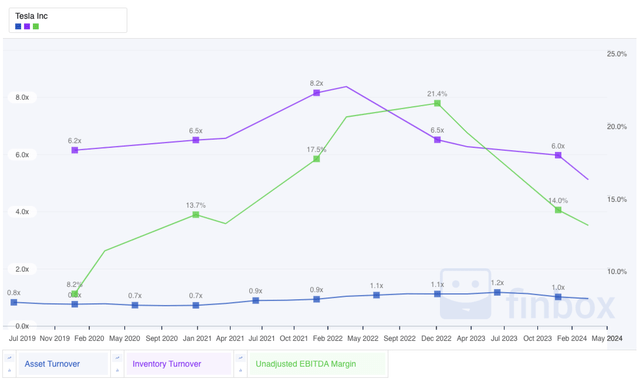
Tesla Efficiency Ratios (FinBox)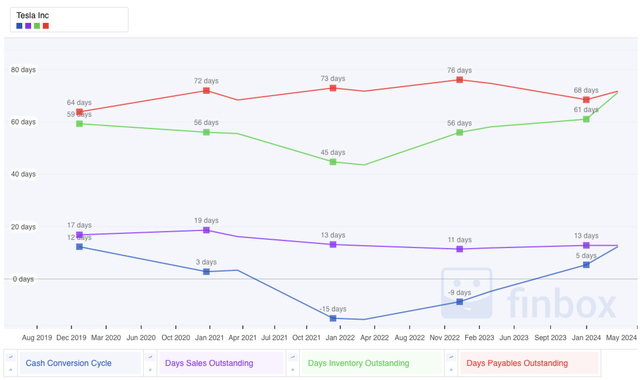
Inventory and asset turnover ratios communicate how well a company monetizes its inventory and broader asset base. Tesla’s asset and inventory ratios have dipped sharply since our last coverage, suggesting it overestimated its sales potential. We highlight this as a salient risk factor going forward.
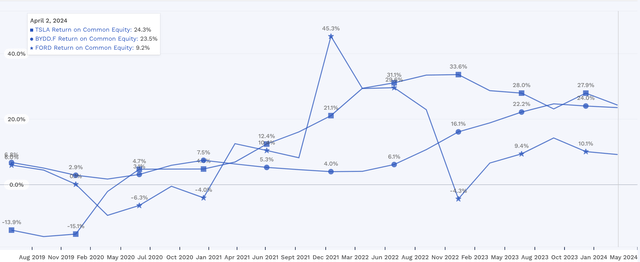
Despite recently facing contrasting sales trajectories to its peers (BYD, NIO, and Ford), Tesla’s return-on-common equity remains robust. In fact, Tesla’s ROE is about 80 basis points higher than BYD’s and 15.1% higher than Ford’s.
We think Tesla’s ROE illustrates shareholder value. However, we are worried about its quarter-over-quarter ROE dip, especially given the firm’s fundamental headwinds.
Potential Shareholder Returns
Valuation
You will very rarely see us use a DCF model or related valuation methodology to value stocks. Bonds and real estate, maybe, but not stocks, and especially not stocks secured by companies with unpredictable cash flows.
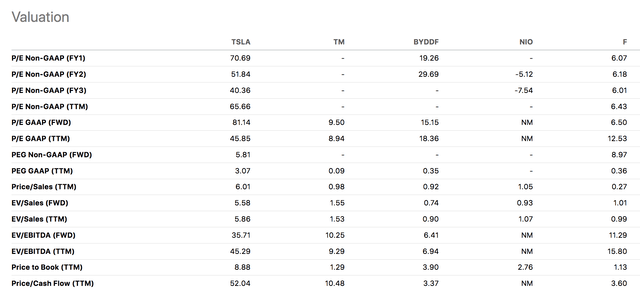
Instead, we prefer to look at relative valuation multiples and technical indicators for a stock like Tesla. The diagram below presents a peer analysis; a discussion follows.
Our earlier argument stated that Tesla had entered a shakeout phase, which we stand by. However, keep in mind that sources anticipate the EV market to grow exponentially for the remainder of the decade. For instance, analysts at Fortune Business Insights project the EV market will grow by 17.8% per year until 2030.
Considering the abovementioned, we decided to focus on Tesla’s price-to-sales ratio, EV/EBITDA, and price-to-earnings-growth ratio.
The price-to-sales ratio is useful when assessing hypergrowth companies that emphasize blitzscaling. In isolation, we believe Tesla’s P/S ratio of 6.01x is well-placed for a growth stock. However, it ranks low if compared to peers such as BYD and NIO, who both have P/S ratios near one.
Furthermore, considering Tesla’s EV/EBITDA ratio is essential. The EV/EBITDA ratio conveys whether a firm’s free cash flow (EBITDA is often used as a cash flow proxy) matches its size. Moreover, EBITDA is outlined as innovative firms such as Tesla often load heavily on amortization, which can be a subjective accounting line item.
At a glance, Tesla’s EV/EBITDA is respectable. However, as with its P/S ratio, Tesla’s EV/EBITDA is well above those of its peers, communicating relative valuation problems.
Lastly, the PEG ratio looks at the speed of a firm’s earnings-per-share growth relative to its stock price. Many of Tesla’s counterparts don’t have PEG ratios as they are blitzscaling and, therefore, operate at losses. Nevertheless, Tesla’s PEG ratio of 3.07x is above the theoretical threshold of one, which concerns us.
Technical Analysis
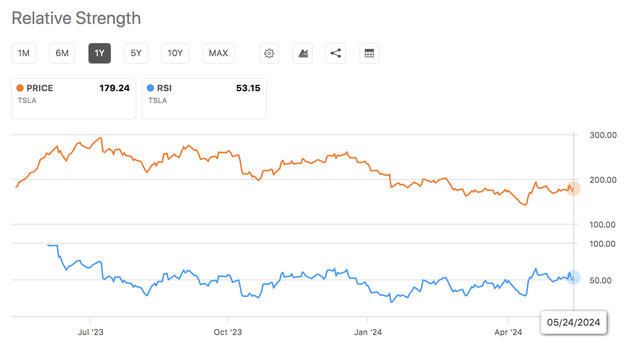
The first data point we observed in our technical analysis of Tesla was its SMAs. We saw that Tesla’s stock recently exceeded its 10- and 50-day moving averages, while remaining below its 100- and 200-day moving averages. In isolation, this signals the start of a momentum trend. However, additional research is required to consolidate such a claim.
The above folds into Tesla’s relative strength index. Tesla’s RSI is in the low 50s, suggesting it has room to roam into before it is considered overbought (70+ is considered overbought).
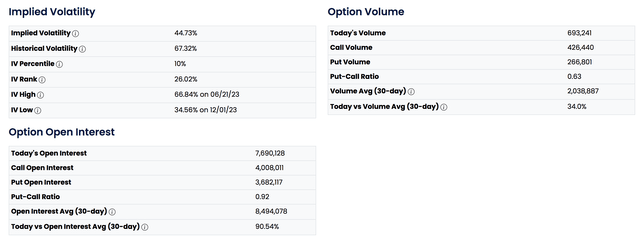
According to Option Charts, Tesla has a put-call ratio of 0.63, indicating optimism from the options market. However, the put-call ratio is often considered a countercyclical metric. As such, we fear that options traders might change their narrative, especially if the implied market volatility increases.
In a nutshell, Tesla’s technical indicators are conflicting. Nevertheless, they seem better placed than the stock’s valuation multiples.
Risks To The Analysis
The primary risk to the analysis is that it downgrades Tesla’s stock after a slump. The market could act contrarian and “buy the dip.” Therefore, the timing of the analysis sets forth a risk.
Furthermore, Tesla’s energy storage business and the influence of AI on key supply chain areas weren’t discussed. Although a stock analysis doesn’t have to cover all bases, we believe these factors could play a role. However, they are slightly esoteric, and therefore, we didn’t provide an opinion.
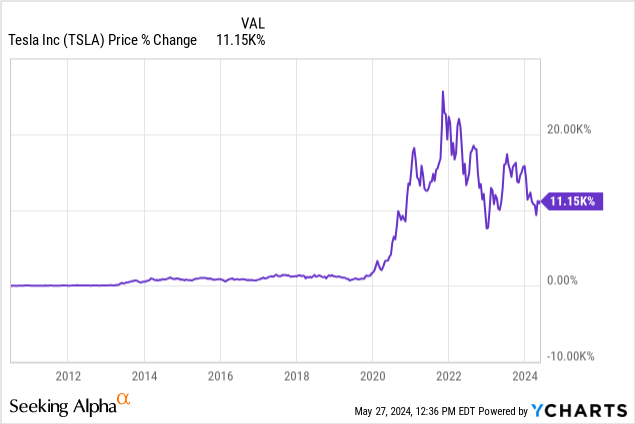
Lastly, many have underestimated Tesla since its public listing. Yet, it has produced mouthwatering returns. Thus, any negative outlook on Tesla’s stock risks being horribly wrong.
Final Word
Our revision of Tesla’s stocks led us to downgrade the asset to Hold from our previous Strong Buy rating.
In our opinion, Tesla faces a host of systematic headwinds as we believe the EV industry’s recent price cuts signal a shakeout phase. Furthermore, BYD Company’s resilient growth threatens Tesla’s China endeavors and broad-based market share. Therefore, suggesting additional price cuts might be en route.
Other noteworthy factors are Tesla’s decreasing turnover ratios and its questionable peer-based valuation. Although positives exist, we downgrade the asset to Hold.

